Monthly Labor Market Report: Easing the pressure in hospitality

Key points

  • Hourly pay in front-of-house hospitality roles fell in August and may continue to drop in September, though demand was strong.
  • Concession and stand workers are in especially high demand, with pay expected to take off next month.
  • Instawork Pros had fewer jobs of any kind in August but worked more hours than in July.
  • The vast majority of Instawork Pros wanted to work 2-4 shifts per week or more at the same business.

Every day, the Instawork platform handles thousands of transactions involving businesses and hourly professionals, generating a huge amount of data on hourly pay as well as other aspects of the labor market. This report summarizes some of the major trends in demographics, roles, and worker constraints in regions across the United States.

To receive future economic insights from the Instawork Economic Research Division, please subscribe by visiting: https://hubs.li/Q012kZ--0

The data are also compiled into the Instawork Pay Signal Index (PSI) and indexed trends in hourly pay. Because businesses can book shifts in advance on the Instawork platform, the metrics include forward-looking data for the current month as well. Please refer to the appendix for explanations of the methods behind each metric.

Demand for hospitality roles was strong on the Instawork platform in August, but hourly pay for many front-of-house roles declined slightly. Overall, the data suggest that labor supply is finally catching up to demand in a sector that was deeply affected by the Covid-19 pandemic.

After a majority of businesses across all sectors on the Instawork platform raised pay in July, there was a small pullback in August that is expected to continue into September. If this happens, it would be the first time since January and February that a majority of businesses lowered pay for two straight months:

In-app survey data

Our in-app surveys track Pros' labor market situations on a monthly basis. For details on methods and questionnaires, please see the Methodological Appendix below.

Here is the distribution of Pros by the jobs they worked up through the reference week (14 August 2023) this month:

Though work in most categories slipped in August, the share of Pros with no work also dropped slightly. Overall, during the past several months Pros' preferences for full-time and part-time work were fairly steady, while the shares looking for app-based and temporary work dipped:

In August, the share of Pros working 30 hours or fewer was at its lowest level in the past six months, with the biggest increase among Pros working 41-50 hours:

By contrast, preferences for hours dropped in August among Pros who were looking for 30 hours of work or less:

Overall, Pros were having an easier time finding the hours they wanted in August, with identical shares saying they wanted 21-30 and 31-40 hours of work to the shares of Pros who actually worked those hors.

In August we also asked Pros about their preferences for recurring shifts at the same businesses:

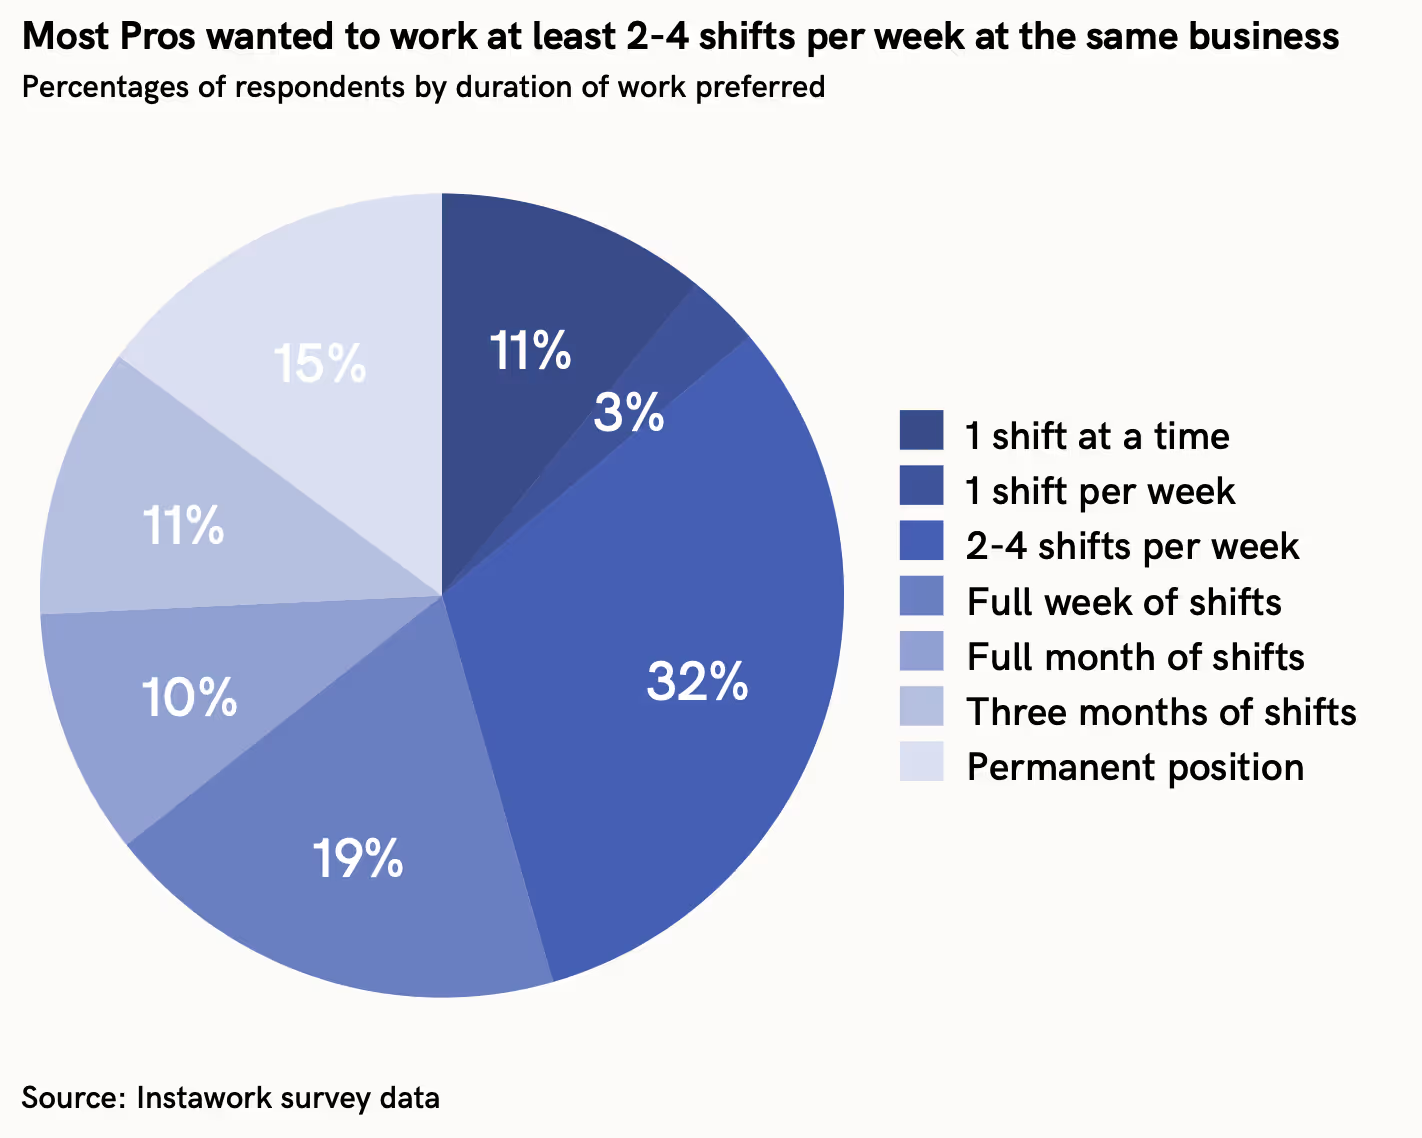
The vast majority of Pros wanted to work at least two to four shifts per week at the same business, with 55% saying they wanted at least a full week of shifts. These Pros are ideal for businesses that want to use an experienced group of flexible workers on a recurring basis – to cover for employees taking time off, to reduce overtime, or as a pool of potential hires.

Recent growth in flexible work

Because flexible work is one of several options that workers might have in the labor market, increases in flexible work may mean decreases in other areas. The following statistics measure differences in shift work booked on the Instawork platform (measured in hours), month over month:

 Regions with the highest growth of flexible work  

 Regions with lowest growth of flexible work  

 1. Las Vegas, NV

 1. Salt Lake City, UT

 2. Pittsburgh, PA

 2. Inland Empire, CA

 3. San Antonio, TX

 3. Houston, TX

 4. Bay Area, CA

 4. San Diego, CA

 Roles with the highest growth of flexible work  

 Roles with lowest growth of flexible work  

 1. Concession/stand worker

 1. Housekeeper

 2. Food service worker

 2. Custodial

 3. Event server

 3. Runner

 4. Event setup and takedown

 4. Busser

Demand for food service workers continued to climb steeply in August, as did demand for other leisure and hospitality roles. Private events rebounded, with higher demand and larger event sizes leading to an increase in the use of onsite captains as well. But shifts for concession and stand workers grew the most as arena and stadium events continued to draw big crowds.

Technical note: To control for the growth of the Instawork platform, only business locations that have participated for at least two months before the start of the comparison period are included. Changes in hours are included only for roles for which businesses booked shifts during both months.

Demographics of flexible workers

Trends that began early in the year resumed in August, with a lower share of men and a higher share of Black/African-American workers completing shifts via the Instawork platform:

Workers from racial and ethnic minorities have historically been among the first to feel a weakening in the labor market, and their supply of labor on the Instawork platform may indicate a narrowing of other options.

Pay Signal Index

Hourly pay fell at the majority of businesses posting hospitality-related shifts in August, and this tendency may continue in September, according to advance bookings on the Instawork platform. A large majority of businesses posting shifts for building and grounds cleaning raised pay, but that number may turn around completely in September. The reverse looks set to occur in sales roles, which had been less volatile until now. Next month a majority of businesses may also lower pay for logistics shifts for the first time since May:

Indexed trends in hourly pay

Hourly pay was steady in most roles during August but fell in almost all front-of-house hospitality roles, with the exception of bussers. Yet hourly pay for bussers looks set to decline in September. Pay for concession and stand workers, one of the fastest-growing roles on the Instawork platform in August, may increase substantially in September. Intermediate warehouse roles may also see a resumption in the upward trend for pay next month after a few months of stability:

To receive future report briefings or data insights from our Economic Research team, please subscribe below.

Methodological Appendix

Instawork in-app surveys

Five surveys per month are delivered via the Instawork Pro app. Random samples of Pros who have worked at least one shift in the past 12 months may be shown a one-question survey when they open the details for a shift. No Pro receives more than one survey per month. The surveys continue until they collect 1,000 responses.

The repeating questions on Pros' labor market situations are as follows:

1. Please mark all the kinds of work you will do this week:

  • regular full-time job
  • regular part-time job
  • shifts booked on Instawork
  • other app-based or temporary work
  • no work

2. Please mark all the kinds of work you would like to do each week:

  • regular full-time job
  • regular part-time job
  • shifts booked on Instawork
  • other app-based or temporary work
  • no work

3. In total, how many hours will you work this week at all your jobs?

  • 0-10
  • 11-20
  • 21-30
  • 31-40
  • 41-50
  • 51 or more

4. In total, how many hours would you like to work each week at all your jobs?

  • 0-10
  • 11-20
  • 21-30
  • 31-40
  • 41-50
  • 51 or more

Instawork PSI (Pay Signal Index)

The PSI gauges the overall direction of changes in hourly pay from month to month, much the way a purchasing managers’ index measures supply chain activity.

To begin, for each month, we measure the average hourly pay offered by each business on our platform for each role in each region. If the business offered shifts for the same role in the same region during the previous month, we record whether the average rose or fell. A rise is recorded as +1, a fall as -1, and no change as 0.

Next we weight this signal by the average number of shifts the business offered for that role across the two months. For example, if the business offered 10 shifts for line cooks in the Houston area during February and 18 shifts for the same role in the same region during March, then the weight would be 14.

We group these weighted signals by the Census Bureau’s occupational categories and take the weighted average for each category. Then we multiply the weighted average by 50 and add it to 50. This yields a PSI between 0 and 100. At 0, the PSI implies that all businesses in the sample offered lower pay. At a PSI of 100, all businesses offered higher pay. At a PSI of 50, businesses that raised or lowered pay did so with equal weight (or loosely, equal numbers of shifts).

At present we cover six major occupational categories. These are the numbers of workers they represented in the Bureau of Labor Statistics’ counts of hourly workers in 2022, and their shares of the total reported number of hourly workers:

 Occupational category

 Workers (1,000s)

 Share of hourly workers

 Transportation

 8,405

 10.7%

 Food preparation and serving  

 6,961

 8.8%

 Sales

 6,919

 8.8%

 Production

 6,583

 8.4%

 Building and grounds cleaning  

 3,551

 4.5%

 Personal care and service

 1,829

 2.3%

To create a national PSI, we calculate a weighted average by weighting the PSI for each occupational category by its share of hourly workers above. The resulting national PSI represents occupational categories that cover roughly 44% of hourly workers in the American labor force.

Indexed trends in hourly pay

Sample selection for our pay trends is similar to the method for the PSI. Businesses that book shifts for the same role in the same region during consecutive months are the units of observation. For each pair of months, we calculate the change in the average hourly pay offered for the given role in the given region. Examples of roles are line cooks, forklift drivers, and custodial staff.

Next, as for the PSI, we weight the changes in pay by the average number of shifts across the two months. Then we calculate a weighted average of the changes at a national level for each role. To create an indexed trend, we have chosen July 2021 as the starting point, where the indexed hourly pay for each role is set to 100. We then use the monthly changes to map the trend from August 2021 onward.

At present we publish the indexed trends in hourly pay for 14 of the roles staffed on our platform:

 Indexed trends in hourly pay available for the following roles:

 Bartender

 Event setup and takedown

 Busser

 General labor

 Concession or stand workers

 Line cook

 Counter staff or cashier

 Prep cook

 Custodial

 Runner

 Dishwasher

 Warehouse associate - entry level

 Event server

 Warehouse associate - intermediate