Monthly Labor Market Report: Falling pay and seasonal patterns

Every day, the Instawork platform handles thousands of transactions involving businesses and hourly professionals, generating a huge amount of data on hourly pay as well as other aspects of the labor market. This report summarizes some of the major trends in demographics, roles, and worker constraints in regions across the United States.

Key points

  • As expected, hourly pay fell on balance at businesses across our flexible work platform in May.
  • Full-time work increased in May as the spring vacation season ended, but there was still a substantial share of flexible workers seeking full-time jobs.
  • Seasonal trends are likely driving slight decreases in pay for some hospitality roles as well.
  • Roughly a third of our Pros are receiving government food aid, and one in five are using government health insurance.

To receive future economic insights from the Instawork Economic Research Division, please subscribe by visiting: https://hubs.li/Q012kZ--0

The data are also compiled into the Instawork Pay Signal Index (PSI) and indexed trends in hourly pay. Because businesses can book shifts in advance on the Instawork platform, the metrics include forward-looking data for the current month as well. Please refer to the appendix for explanations of the methods behind each metric.

A greater share of businesses lowered hourly pay on our platform in May than in any month since June 2022. Both drops followed surges in demand for in-person services – and hence rising pay – in the early part of the spring:

30 May 2023 Pay Signal Index - national

In-app survey data

Our in-app surveys track Pros' labor market situations on a monthly basis. For details on methods and questionnaires, please see the Methodological Appendix below.

Here is the distribution of Pros by the jobs they worked up through the reference week (15 May 2023) this month:

30 May 2023 iaps 3 jobs actual

With the end of spring vacations, most forms of work increased. Here is a similar breakdown for the types of jobs Pros wanted to work:

30 May 2023 iaps 3 jobs want

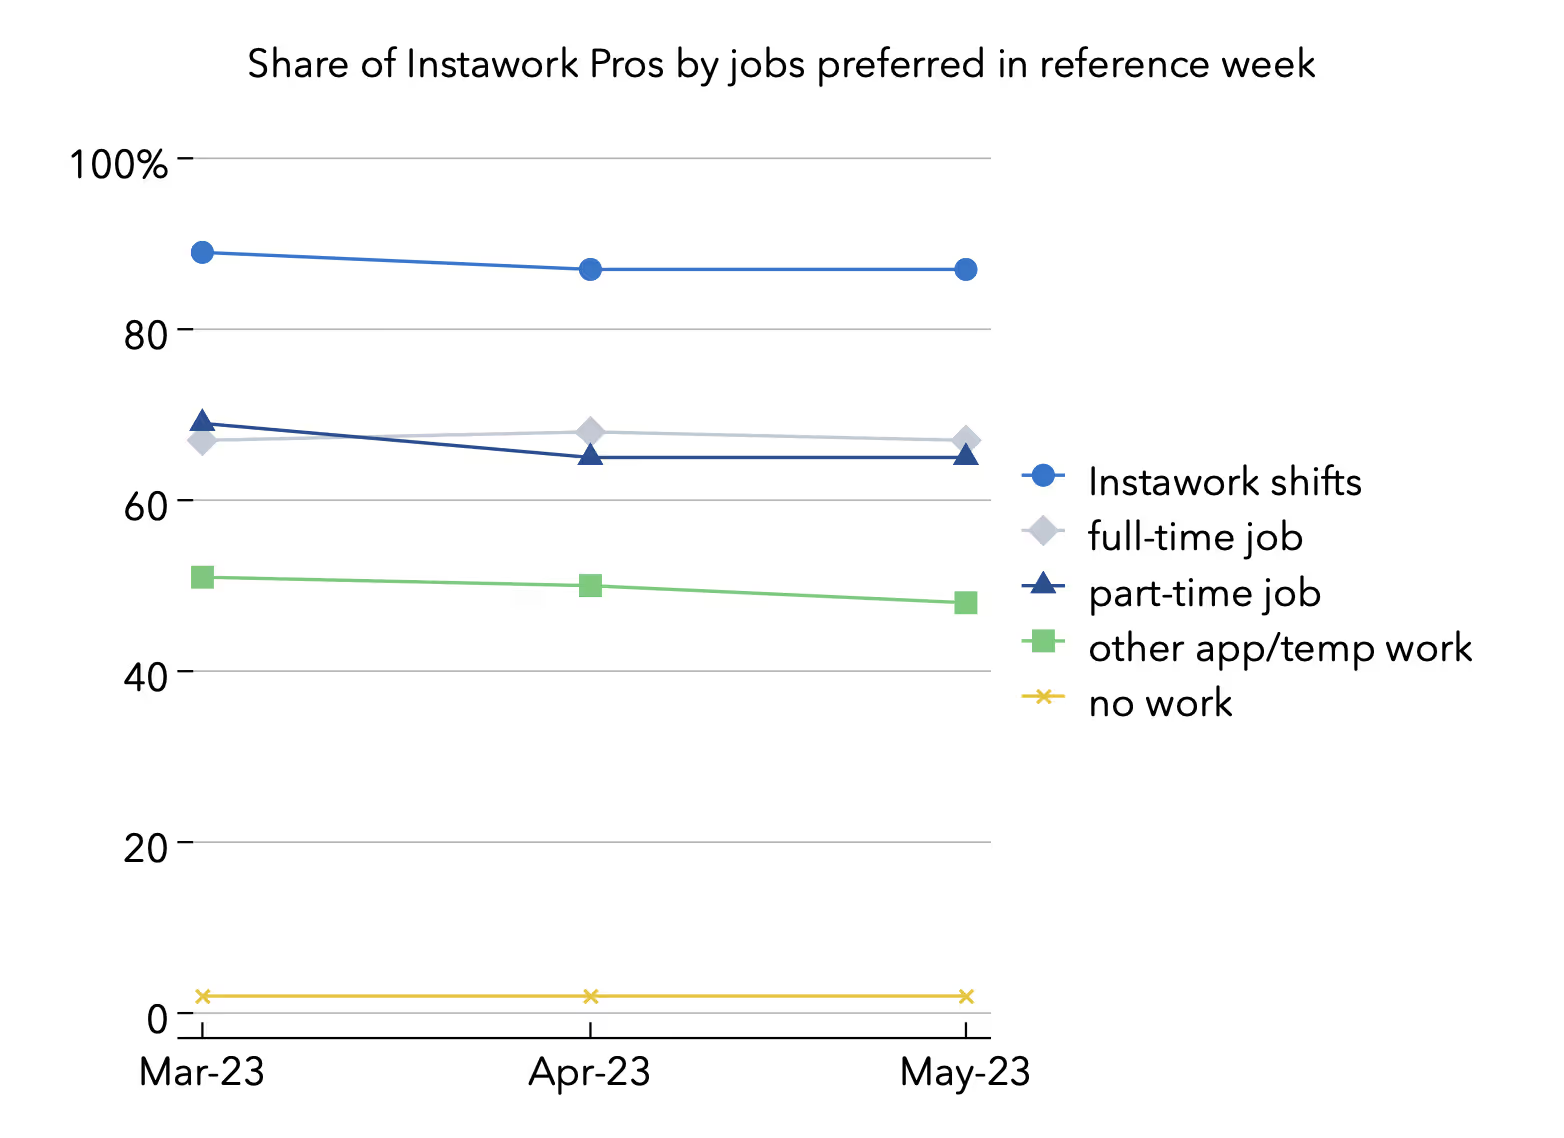
Slightly fewer Pros wanted full-time jobs, and the desire for other app/temp work continued to fall. But the share of Pros who actually worked full-time jobs was about 20% lower than the share of Pros who wanted full-time jobs. We expect this gap to widen if the economy enters a deeper downturn.

As one might expect given the uptick in full-time work, fewer Pros worked 0-10 hours last month. The biggest increase was in the 31-40 hours range:

30 May 2023 iaps 3 hours actual

Indeed, the share of Pros who wanted to work more than 40 hours also shrank slightly in May:

30 May 2023 iaps 3 hours want

Very few Pros wanted to work 0-10 hours last month, and a steady three-quarters wanted to work 31 hours or more. We will see if this trend continues as we enter the school vacation period.

In May we also asked our Pros about their use of government assistance. Here are their responses:

30 May 2023 iaps 3 government assistance

The majority of Pros said they received no government assistance, but roughly a third said they used the Supplemental Nutrition Assistance Program (SNAP) or other food aid. This is a substantial share of people who are clearly showing a desire to work and earn income but still require extra help to feed themselves and their families.

Almost one in five Pros said they used government health insurance. Since most of our Pros are below the eligibility age for Medicare, the majority of these Pros are probably receiving Medicaid. Families with incomes up to 138% of the federal poverty level – about $34,000 for a family of three – are typically eligible for Medicaid. To earn this amount over an average year, a worker would have to receive about $17 per hour.

Only a small share of Pros said they used government-provided Pre-K or day care. This is an issue of substantial interest for hourly workers, since child care is often crucial to their availability to work. Last month we learned that almost 60% of Pros had to care for children in addition to working. A few cities, like New York, have instituted free pre-K for four- or even three-year-olds, but they are the exception rather than the rule.

Recent growth in flexible work

Because flexible work is one of several options that workers might have in the labor market, increases in flexible work may mean decreases in other areas. The following statistics measure differences in shift work booked on the Instawork platform (measured in hours), month over month:

Regions with the highest growth of flexible workRegions with the lowest growth of flexible work1. Inland Empire, CA1. Providence, RI2. Las Vegas, NV2. Atlanta, GA3. New Orleans, LA3. Columbus, OH4. Pittsburgh, PA4. San Antonio, TXRoles with the highest growth of flexible workRoles with the lowest growth of flexible work1. Concession/stand worker1. Custodial2. Warehouse associate – entry level2. Food service worker3. Bartender3. Counter staff/cashier4. Event server4. BusserGrowth of flexible work was again very strong in the Inland Empire area of California, and it also rebounded in Las Vegas. Customer-facing concession and event shifts continued to grow quickly as baseball and the spring events season got into full swing.

Technical note: To control for the growth of the Instawork platform, only business locations that have participated for at least two months before the start of the comparison period are included. Changes in hours are included only for roles for which businesses booked shifts during both months.

Demographics of flexible workers

The share of men working shifts on the platform fell for the third straight month, and the share of white workers dropped for two months straight after a long increase. Because non-white and non-male workers have historically had a harder time finding full-time jobs in a soft labor market, these could be signs of further cooling in the economy:

30 May 2023 gender breakdown for jobs package
30 May 2023 race breakdown for jobs package

Pay Signal Index

Hourly pay dropped in light industrial work – production, transportation, and logistics – and looks set for a decline in services as well. Pay also continued its steep dip in building and grounds cleaning after a seasonal spike in March. The overall message is that service businesses again had trouble staffing up in the spring and are now at more normal levels, while businesses in goods-related industries may be moving sideways as they wait to see how orders evolve for the second half of the year:

30 May 2023 Pay Signal Index for building and grounds cleaning
30 May 2023 Pay Signal Index for food preparation and serving
30 May 2023 Pay Signal Index for personal care and service
30 May 2023 Pay Signal Index for production
30 May 2023 Pay Signal Index for sales
30 May 2023 Pay Signal Index for transportation and material moving


Indexed trends in hourly pay 

Hourly pay was steady in most roles in May, albeit with some slight drops in hospitality roles. Pay for custodial and higher-skill warehouse positions may keep climbing in June, and pay for bussers may also recover after several months of decreases. General labor, which previously had steady pay since September 2022 as the supply of workers on our platform expanded, looks poised for a small rise in pay next month as well:

30 May 2023 pay trend for bartender


30 May 2023 pay trend for busser
30 May 2023 pay trend for concession or stand worker
30 May 2023 pay trend for counter staff or cashier
30 May 2023 pay trend for custodial
30 May 2023 pay trend for dishwasher
30 May 2023 pay trend for event server
30 May 2023 pay trend for event setup and takedown
30 May 2023 pay trend for general labor
30 May 2023 pay trend for line cook
30 May 2023 pay trend for prep cook
30 May 2023 pay trend for runner
30 May 2023 pay trend for warehouse associate - entry level
30 May 2023 pay trend for warehouse associate - intermediate

To receive future report briefings or data insights from our Economic Research team, please subscribe below.

Methodological Appendix

Instawork in-app surveys

Five surveys per month are delivered via the Instawork Pro app. Random samples of Pros who have worked at least one shift in the past 12 months may be shown a one-question survey when they open the details for a shift. No Pro receives more than one survey per month. The surveys continue until they collect 1,000 responses.

The repeating questions on Pros' labor market situations are as follows:

1. Please mark all the kinds of work you will do this week:

  • regular full-time job
  • regular part-time job
  • shifts booked on Instawork
  • other app-based or temporary work
  • no work

2. Please mark all the kinds of work you would like to do each week:

  • regular full-time job
  • regular part-time job
  • shifts booked on Instawork
  • other app-based or temporary work
  • no work

3. In total, how many hours will you work this week at all your jobs?

  • 0-10
  • 11-20
  • 21-30
  • 31-40
  • 41-50
  • 51 or more

4. In total, how many hours would you like to work each week at all your jobs?

  • 0-10
  • 11-20
  • 21-30
  • 31-40
  • 41-50
  • 51 or more

Instawork PSI (Pay Signal Index)

The PSI gauges the overall direction of changes in hourly pay from month to month, much the way a purchasing managers’ index measures supply chain activity.

To begin, for each month, we measure the average hourly pay offered by each business on our platform for each role in each region. If the business offered shifts for the same role in the same region during the previous month, we record whether the average rose or fell. A rise is recorded as +1, a fall as -1, and no change as 0.

Next we weight this signal by the average number of shifts the business offered for that role across the two months. For example, if the business offered 10 shifts for line cooks in the Houston area during February and 18 shifts for the same role in the same region during March, then the weight would be 14.

We group these weighted signals by the Census Bureau’s occupational categories and take the weighted average for each category. Then we multiply the weighted average by 50 and add it to 50. This yields a PSI between 0 and 100. At 0, the PSI implies that all businesses in the sample offered lower pay. At a PSI of 100, all businesses offered higher pay. At a PSI of 50, businesses that raised or lowered pay did so with equal weight (or loosely, equal numbers of shifts).

At present we cover six major occupational categories. These are the numbers of workers they represented in the Bureau of Labor Statistics’ counts of hourly workers in 2022, and their shares of the total reported number of hourly workers:


Occupational categoryWorkers (1,000s)Share of hourly workersTransportation and material moving8,40510.7%Food preparation and serving6,9618.8%Sales6,9198.8%Production6,5838.4%Building and grounds cleaning3,5514.5%Personal care and service1,8292.3%

To create a national PSI, we calculate a weighted average by weighting the PSI for each occupational category by its share of hourly workers above. The resulting national PSI represents occupational categories that cover roughly 44% of hourly workers in the American labor force.

Indexed trends in hourly pay

Sample selection for our pay trends is similar to the method for the PSI. Businesses that book shifts for the same role in the same region during consecutive months are the units of observation. For each pair of months, we calculate the change in the average hourly pay offered for the given role in the given region. Examples of roles are line cooks, forklift drivers, and custodial staff.

Next, as for the PSI, we weight the changes in pay by the average number of shifts across the two months. Then we calculate a weighted average of the changes at a national level for each role. To create an indexed trend, we have chosen July 2021 as the starting point, where the indexed hourly pay for each role is set to 100. We then use the monthly changes to map the trend from August 2021 onward.

At present we publish the indexed trends in hourly pay for 14 of the roles staffed on our platform:

Screen Shot 2022-03-28 at 10.47.23 AM